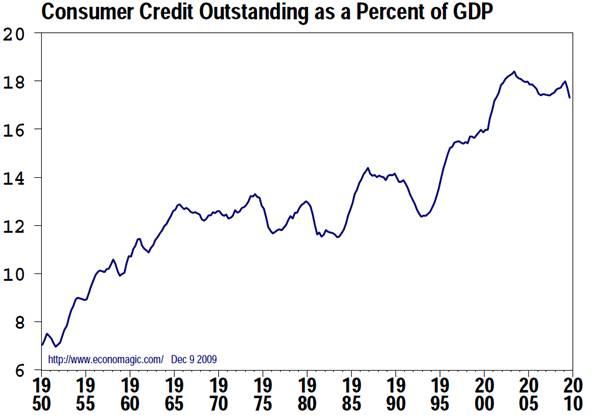
Most economists and analysts do a poor job of capturing the juxtaposition between normal cyclical recovery expectations and long-term headwinds from structural consumer over-indebtedness. Those who argue for a perpetuation of the consumer credit cycle that began post WWII and accelerated exponentially starting in 1982, with a steepening in 1994, must implicitly believe that household debt can grow to the sky.
If instead we acknowledge that households have accumulated new debt equal to 50% of rolling GDP since 1980 (chart below), thereby doubling aggregate household debt outstanding to ~102%, this implies a 2.4% p.a. boost to aggregate consumer spending over that time period. Assuming average consumer spending as a proportion of GDP was 65% over this horizon, this amounted to a boost of ~1.6% p.a. to U.S. GDP.
This analysis is upwardly biased by mortgage debt, which only flows through to GDP in the form of rents, new home construction and sales, and consumption funded by 2nd mortgages or home equity lines of credit. If we just take the increase in consumer credit (revolving and non-revolving) since 1980 (chart below), which has increased from 12.93% of GDP to 17.988% of GDP, our analysis yields a boost of 1.15% p.a. as a result of this new consumer debt. With consumer spending at 65% of GDP this would have resulted in a boost of 0.75% p.a. from unsecured lines of credit, credit card debt, and car loans alone.
It is difficult to know to what degree mortgages to purchase existing homes biased the first analysis higher, or to what degree not accounting for home equity lines of credit and second mortgages biased the second analysis lower. I think it is safe to say, however, that the annual boost to U.S. GDP from the expansion in consumer debt is between 1% and 1.25% per annum between 1980 and 2009.
Importantly, if consumer debt somehow remains constant at current nosebleed levels going forward, U.S. GDP will grow at a rate 1% - 1.25% below average growth rates since 1980. If however consumers pay-down debt at the same pace that they accumulated it from 1980 - 2008, GDP growth will drop by a further 1% - 1.25%. This would then shave a total of 2% - 2.5% from GDP growth potential, which puts likely growth rates for U.S. GDP between 1% and 2% p.a. for the foreseeable future, barring the creation of another consumer credit cycle.
Interestingly, Japanese GDP growth averaged 1.9% during its 'Lost Decade' from 1990 - 2000 after posting 10+ years of 3 - 4% growth leading up to the Nikkei's 1989 peak. Despite aggressive policies by the BOJ to bring rates to zero and a massive buildup in Japanese government debt to offset corporate and household balance sheet rebuilding, Japanese GDP was exceedingly volatile through the 1990s and share prices dropped by 65% over the decade. Of course, they are almost 75% below their 1989 peak today.
Given this anemic consumption scenario, and the Japanese template for a debt deflation scenario, investors should be asking to what degree the market is discounting a long period of slower economic growth. With consumers retrenching, boomers retiring, and government indebtedness likely to necessitate higher corporate and personal taxes in the future, is it likely that stock market valuations will continue to hold at 1980 - 2008 levels relative to the size of the economy? Or is it possible that they may revert to levels that dominated for most of the last century.
Chart: Ratio of U.S. Stock Market Capitalization to U.S. GDP
Source: Ned Davis Research 


Indebtedness seems to be much correlated to interest rates. Until rates go higher what is an investor to do with their savings, put it into a T-bill fund where it doubles every 6000 years (ala Gross).
ReplyDelete